
NFER Assessment - Guide For Parents
Assessment Reporting
Following feedback from parents, this information is designed to help you understand your child’s assessment results. In late November, pupils sit NFER tests in Reading, Punctuation and Grammar, Spelling, and Maths. We share these results with you alongside your child's teacher-assessed writing judgements. Standardised scores can be confusing, and not all tests use the same system, so this guide aims to explain what the scores mean for you and your child.
We have broadened our assessment categories so that progress over time is easier to see. Pupils will also take NFER tests in the spring and summer terms, giving three data points across the year.
Understanding standardised scores
Standardised scores allow us to compare a pupil’s performance with that of a large national sample.
NFER tests are standardised for the term in which they are intended to be taken. This means autumn tests are compared with national autumn data, spring tests with spring data, and summer tests with summer data. A standardised score of 100 represents the national average for that term. A pupil scoring 100 is therefore performing in line with pupils nationally.
If a pupil achieves a similar standardised score across consecutive tests, it indicates consistent performance and progress in line with national expectations. A significant increase in standardised score suggests more than average progress, while a significant decrease suggests less than average progress and may indicate the need for closer monitoring.
Pupils first receive a raw score based on the number of marks achieved across the test papers. For example, the maths assessment includes a mental arithmetic paper and two written papers. These raw scores are then converted into a standardised score.
|
Standardised score |
|
|
|
Below 70 |
Much below average |
WTS |
|
70 - 84 |
Below average |
WTS + |
|
85 - 94 |
Low average |
EXS - |
|
95 - 105 |
Average |
EXS |
|
106 – 115 |
High average |
EXS + |
|
116 – 130 |
Above average |
GDS |
|
131+ |
Much above average |
GDS + |
We recognise that some pupils do not perform at their best in formal test situations, and test outcomes may not always reflect their full ability. Teachers therefore rely on ongoing assessment throughout the year, building a broader and more accurate picture of each child’s learning. While we appreciate that tests are not always enjoyable, they play an important role in helping pupils become familiar with the routines and expectations of formal assessment. This gradual exposure supports their confidence and readiness for statutory testing in Year 6 and for future examinations.
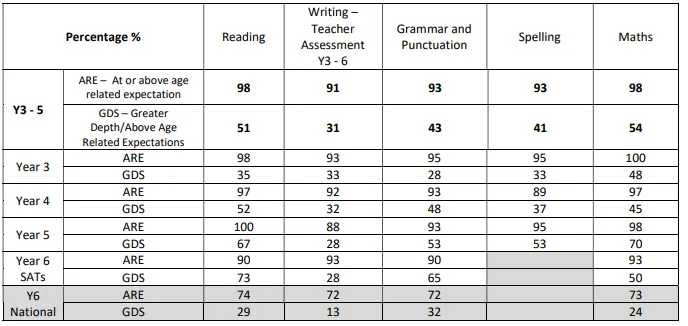
Whole School Assessment Results - Academic year 2024-2025
Page updated April 2026


